Difference between revisions of "Kundalini Profile Survey Analysis"
From KundaliniWiki.org
(Reformatted images and consolidated explanation text for Summary Information) |
|||
| Line 2: | Line 2: | ||
== Summary Information == | == Summary Information == | ||
| − | |||
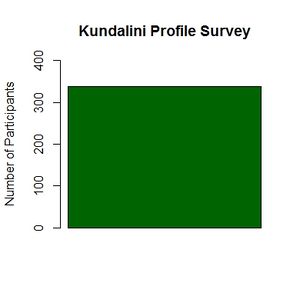
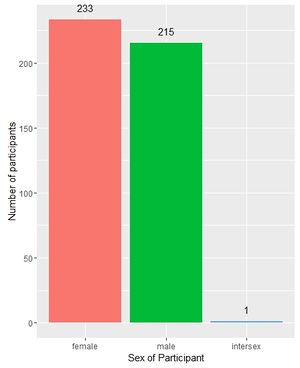
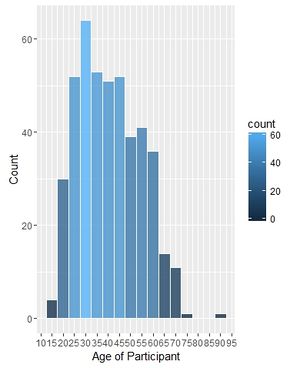
| − | + | To date 338 people from all walks of life and from across the globe have participated in the Kundalini Profile Survey. There has been broadly an equal participation from men and women, although there were slightly more women who took part. People of all ages have taken part in the survey with the majority of respondants being around the age of 30. | |
| − | + | {| | |
| − | [[File:SexParticipants.jpeg|thumb| | + | |[[File:NumberParticipants.jpeg|thumb|center|Number of Survey Participants]] |
| + | |[[File:SexParticipants.jpeg|thumb|left|Sex of Survey Participants]] | ||
| + | |[[File:AgeParticipants.jpeg|thumb|left|Age of Survey Participants]] | ||
| + | |} | ||
| − | + | ||
| − | + | <br clear=all> | |
== Conduct comparative factor analysis == | == Conduct comparative factor analysis == | ||
Revision as of 11:06, 11 September 2016
All analysis documented on this page is being done by the Emerging Sciences Foundation's Kundalini Data Insights team. Please visit our volunteer page if you'd like to join the effort!
Contents
Summary Information
To date 338 people from all walks of life and from across the globe have participated in the Kundalini Profile Survey. There has been broadly an equal participation from men and women, although there were slightly more women who took part. People of all ages have taken part in the survey with the majority of respondants being around the age of 30.


